Mermaid Diagrams
Reference for creating interactive diagrams using Mermaid syntax with zoom and fullscreen capabilities.
Overview
Use Mermaid diagrams to add flowcharts, sequence diagrams, and other structured visuals directly in your docs. In Documentation.AI, Mermaid diagrams are rendered from fenced code blocks and automatically gain:
-
Interactive zoom controls (in and out, plus reset)
-
Fullscreen viewing for complex diagrams
-
Automatic light/dark theme support that matches your site
Mermaid is a good fit when you want:
-
Repeatable, version-controlled diagrams defined in text
-
Architecture or API flows that evolve with your product
-
Visual explanations that stay readable across themes and layouts
Diagrams are created using the same code block system as other snippets. For a detailed overview of code blocks, see Code and Groups.
Diagrams automatically switch between light and dark themes based on your site's theme settings.
Using with Web Editor
In the Web Editor, Mermaid diagrams are just code blocks with the language set to mermaid.
-
Open or create a page in the Web Editor.
-
Use the slash menu (/) to insert a Code block.
-
In the code block language dropdown, choose
mermaid. -
Paste or write your Mermaid definition inside the block.
For example, in the Web Editor you would configure a code block with language mermaid and content similar to:
Prefer writing in code?
You can switch to MDX view inside the Web Editor to write or edit this component using the same syntax as the Code Editor. This is useful if you want full control while staying in the Web Editor.
For more on inserting and configuring code blocks in the Web Editor, see Code and Groups.
Using with Code Editor
In the Code Editor (Markdown/MDX), Mermaid diagrams are defined as fenced code blocks with the mermaid language identifier.
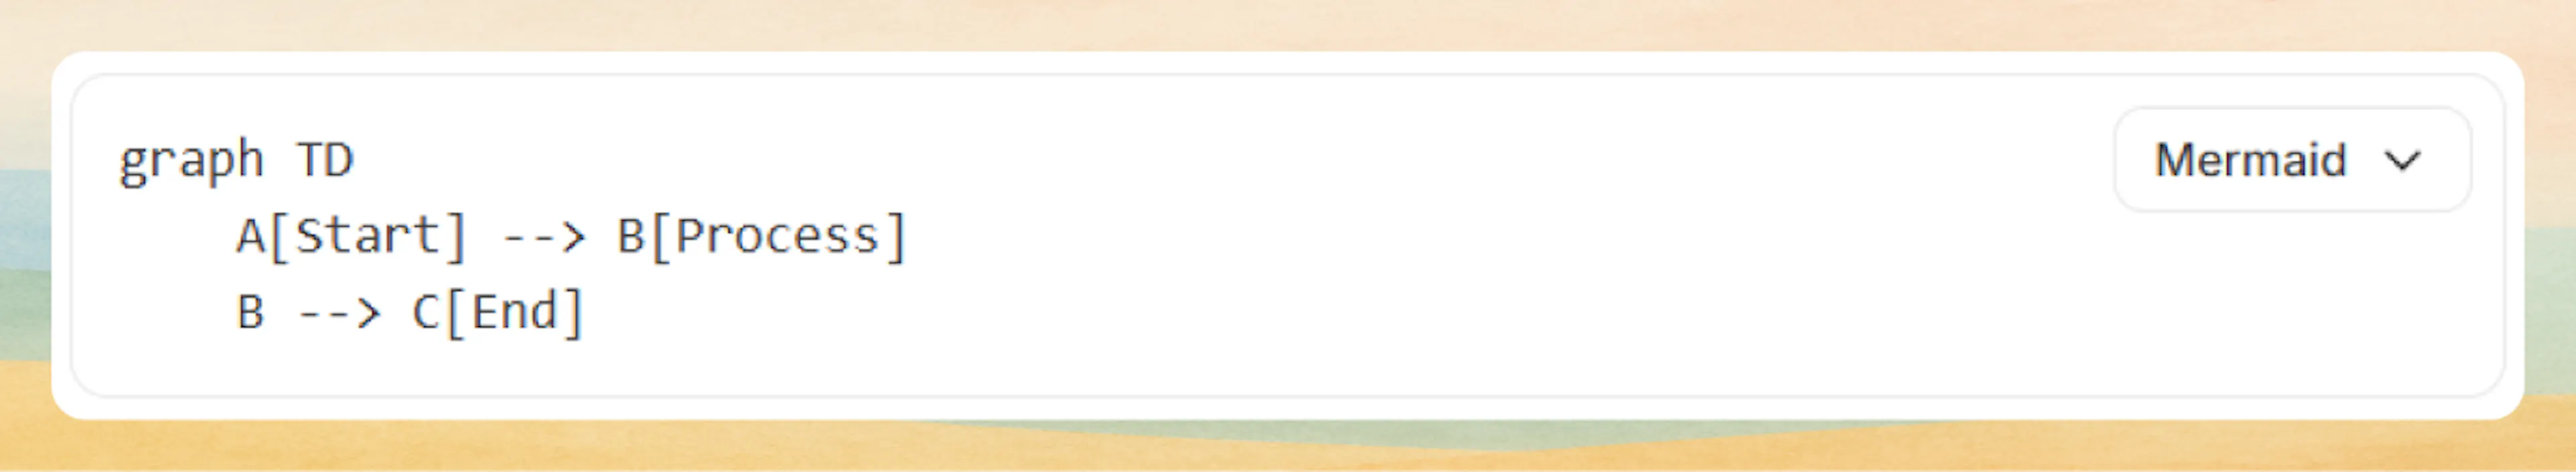
Basic Syntax
```mermaid
graph TD
    A[Start] --> B[Process]
    B --> C[End]
```
Rendered example:
You can mix Mermaid blocks with any other Markdown or MDX content, including Code and Groups when you want to show Mermaid alongside other languages.
Zoom controls
Hover over any diagram to reveal zoom controls in the top-right corner:
-
Zoom In - Magnify the diagram up to 300%
-
Zoom Out - Reduce the diagram down to 50%
-
Reset - Click the percentage to reset to 100%
-
Fullscreen - View the diagram in fullscreen mode
Use fullscreen mode for complex diagrams with many nodes and connections.
Advanced Options
Diagram types:
Flowcharts
Visualize processes, workflows, and decision trees:
```mermaid
graph TD
    A[User Request] --> B{Authenticated?}
    B -->|Yes| C[Process Request]
    B -->|No| D[Redirect to Login]
    C --> E[Return Response]
    D --> F[Show Login Page]
```
Sequence diagrams
Document API calls, interactions, and message flows:
```mermaid
sequenceDiagram
    participant Client
    participant API
    participant Database

    Client->>API: POST /users
    API->>Database: INSERT user
    Database-->>API: Success
    API-->>Client: 201 Created
```
Class diagrams
Show object-oriented structures and relationships:
```mermaid
classDiagram
    class User {
        +String name
        +String email
        +login()
        +logout()
    }
    class Admin {
        +String permissions
        +manageUsers()
    }
    User <|-- Admin
```
State diagrams
Illustrate application states and transitions:
```mermaid
stateDiagram-v2
    [*] --> Idle
    Idle --> Processing: Start
    Processing --> Success: Complete
    Processing --> Error: Fail
    Success --> [*]
    Error --> Idle: Retry
```
Entity relationship diagrams
Design database schemas and relationships:
```mermaid
erDiagram
    USER ||--o{ ORDER : places
    USER {
        string id PK
        string name
        string email
    }
    ORDER {
        string id PK
        string user_id FK
        date created_at
    }
```
Gantt charts
Plan project timelines and milestones:
```mermaid
gantt
    title Project Timeline
    dateFormat YYYY-MM-DD
    section Phase 1
    Design           :2024-01-01, 30d
    Development      :2024-01-15, 45d
    section Phase 2
    Testing          :2024-02-15, 20d
    Deployment       :2024-03-07, 10d
```
Git graphs
Visualize branching strategies and workflows:
```mermaid
gitGraph
    commit
    branch develop
    checkout develop
    commit
    branch feature
    checkout feature
    commit
    commit
    checkout develop
    merge feature
    checkout main
    merge develop
```
Graph directions:
Control flowchart layout orientation:
| Direction | Code | Description |
|---|---|---|
| Top to Bottom | graph TD | Vertical flow (default) |
| Left to Right | graph LR | Horizontal flow |
| Bottom to Top | graph BT | Reverse vertical |
| Right to Left | graph RL | Reverse horizontal |
```mermaid
graph LR
    A[Input] --> B[Process] --> C[Output]
```
Node shapes
Customize node appearance in flowcharts:
```mermaid
graph TD
    A[Rectangle]
    B(Rounded Rectangle)
    C([Stadium Shape])
    D[[Subroutine]]
    E[(Database)]
    F((Circle))
    G>Asymmetric]
    H{Diamond}
    I{{Hexagon}}
```
Arrow types
Define different connection styles:
```mermaid
graph LR
    A --> B
    C --- D
    E -.-> F
    G ==> H
    I -- Text --> J
```
Theme support
Diagrams automatically match your documentation theme:
-
Light mode - Uses default Mermaid theme with light backgrounds
-
Dark mode - Uses dark Mermaid theme with appropriate colors
-
Automatic switching - Updates when theme changes
No additional configuration needed. Theme switching is automatic and instant.
Syntax
Use mermaid as the language identifier in fenced code blocks.
Mermaid diagram definition using valid Mermaid syntax.
Custom identifier for the diagram. Auto-generated if not provided.
Best practices
Keep diagrams readable and accessible:
-
Focus each diagram on a single concept or flow
-
Prefer 10–15 nodes or fewer per diagram
-
Use clear, concise labels for nodes and edges
-
Check readability in both light and dark themes
-
Add nearby text that explains the diagram for screen readers
Use the Mermaid Live Editor at mermaid.live to prototype and validate your diagrams before adding them to your documentation.