Overview & Insights
Understand the different analytics we provide for your documentation and how they help you continuously improve it.
Overview
Analytics gives you a high-level view of how people use your documentation so you can improve it over time. It helps you answer questions such as:
-
How many users visit your docs, and how engaged are they?
-
Which pages get the most attention?
-
What are users searching for, and are they finding what they need?
-
Where do users leave feedback, and what does it tell you about content quality?
What you can track
You can open Analytics from the sidebar. It currently includes three main data groups:
-
Traffic — user behavior metrics that show how people discover, navigate, and engage with your docs over time.
-
Feedback — page-level reactions that highlight where content works well and where readers struggle.
-
Ask AI Analytics — insights into how readers use the AI assistant, what they ask, and where they ask it from.
Use these metrics to understand how readers move through your docs, where they get stuck, and how effectively your content and AI experiences answer their questions.
Traffic
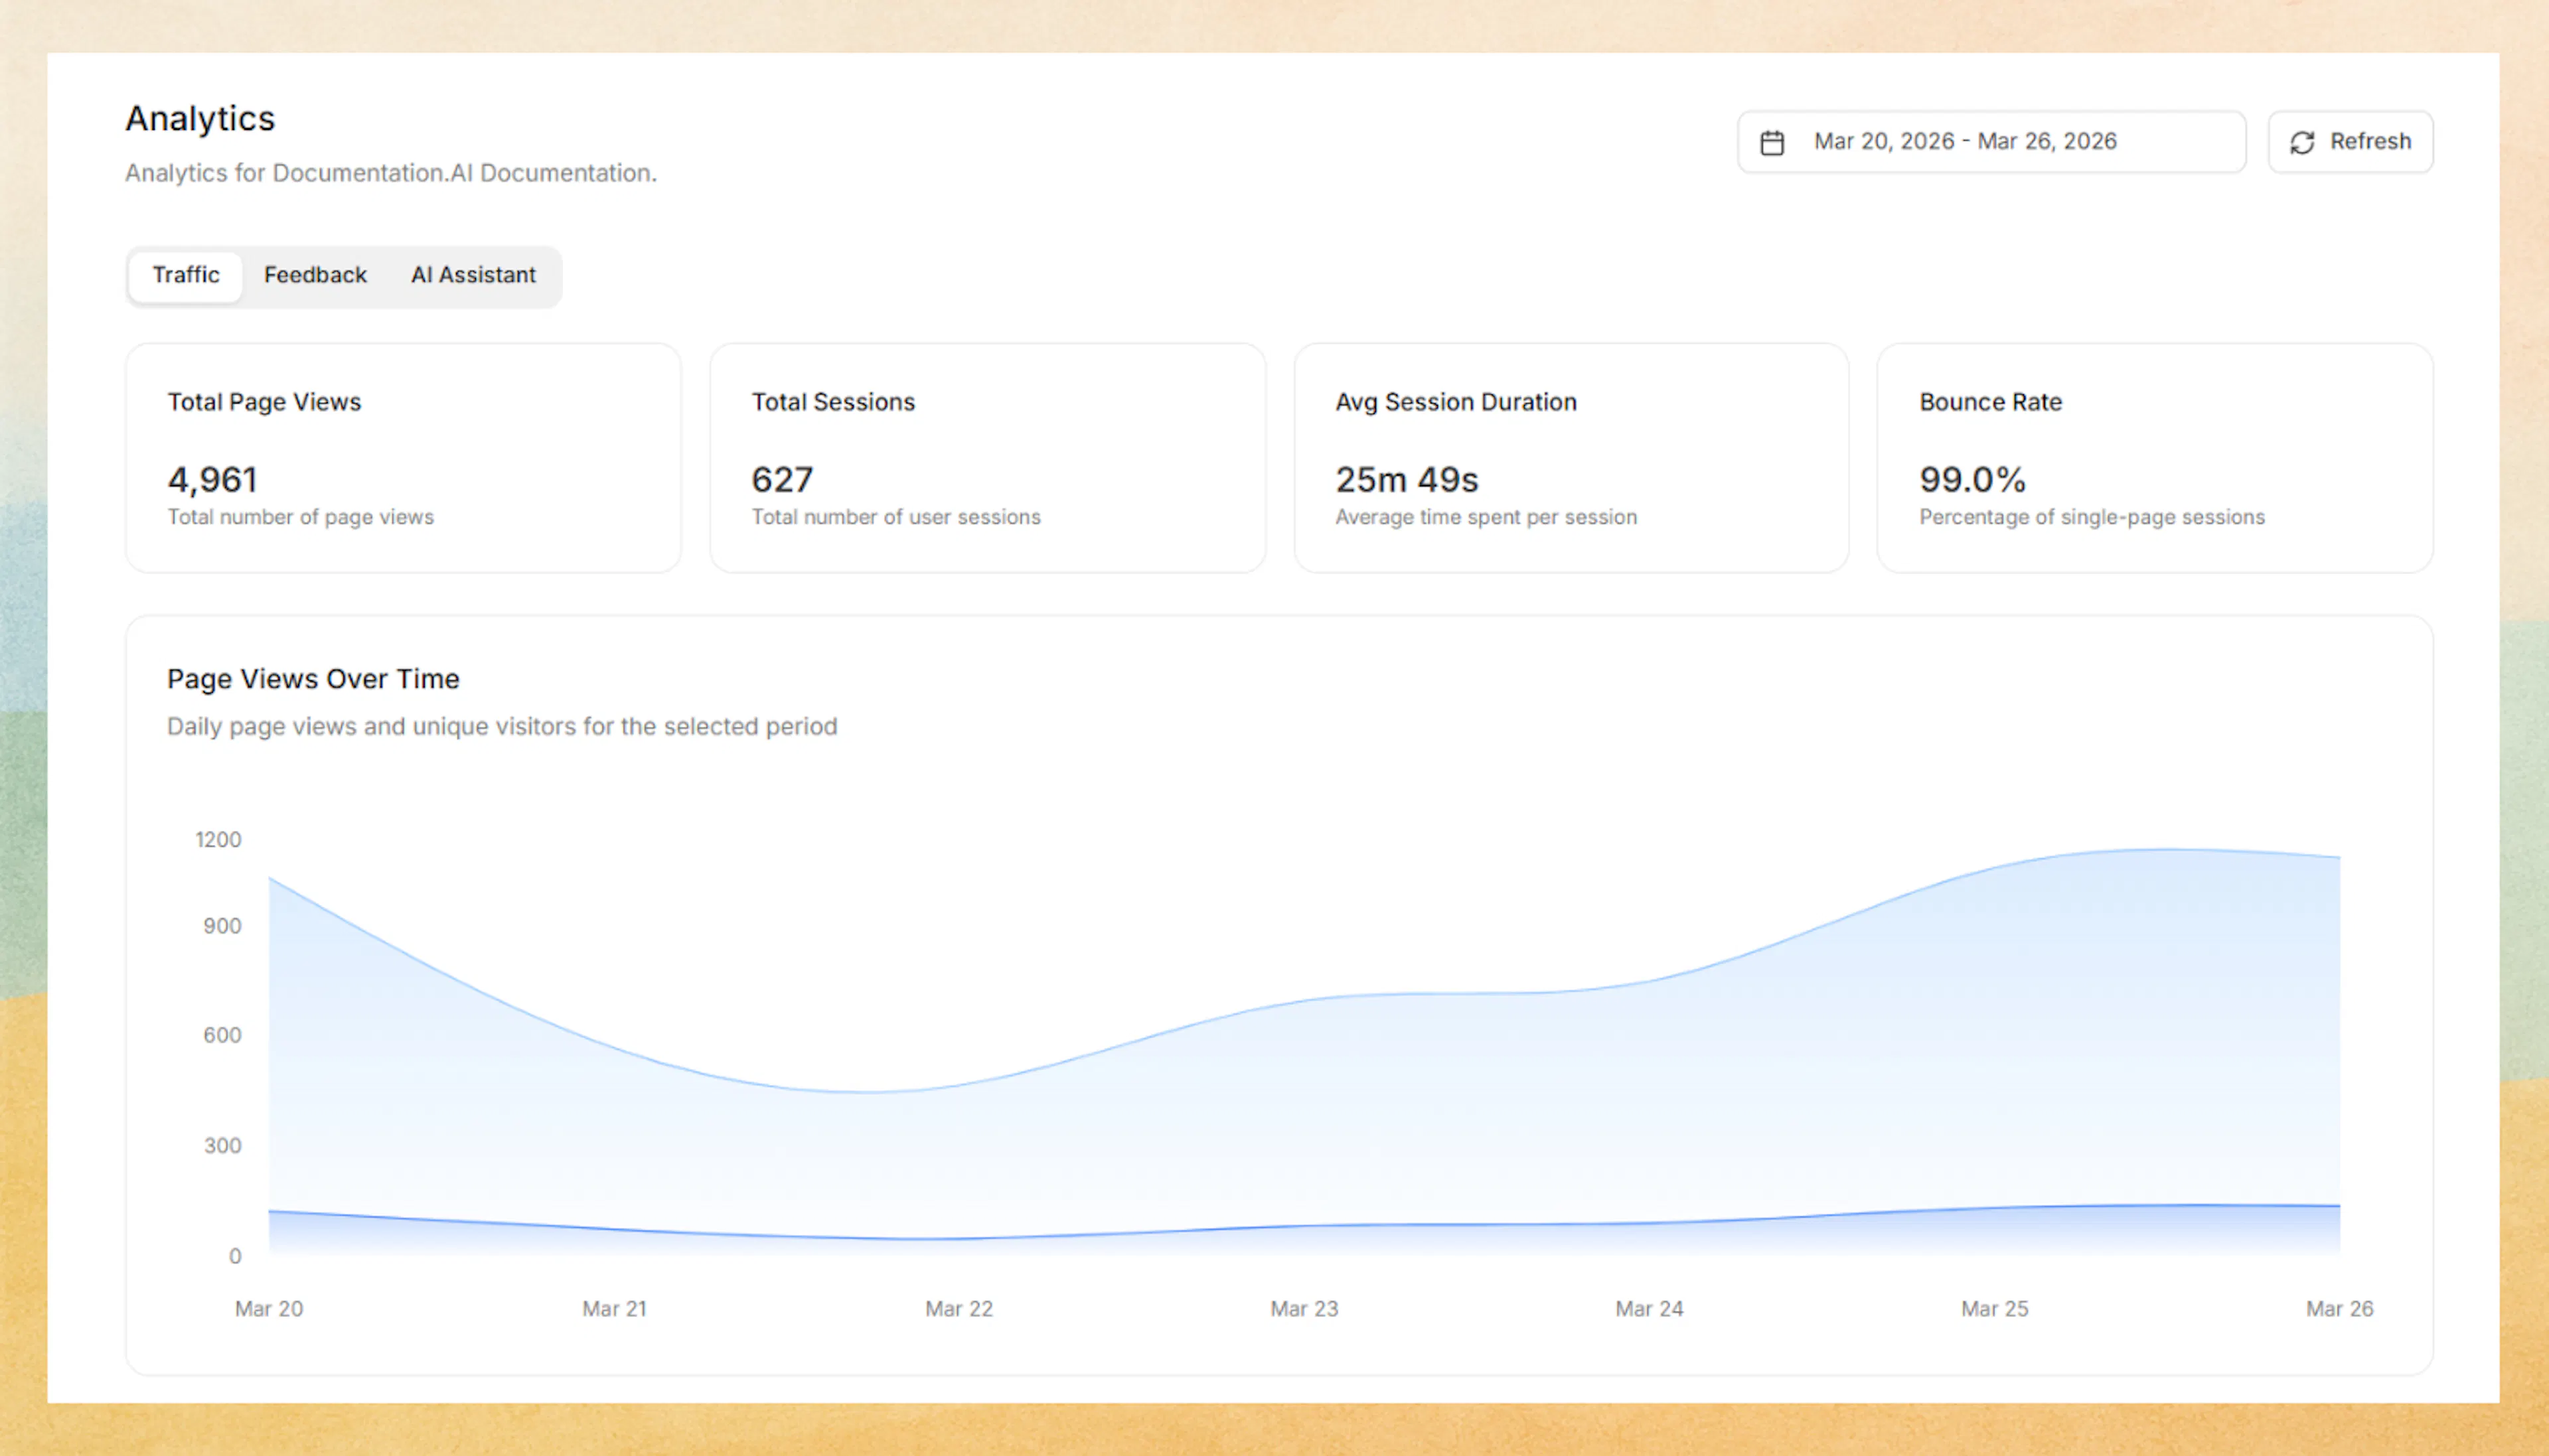
Traffic analytics gives you a date-filtered view of how readers discover and engage with your documentation.
You can track:
-
Total Page Views and Total Sessions
-
Average Session Duration and Bounce Rate
-
Page Views Over Time, including unique visitors for the selected period
-
Most Popular Pages based on traffic volume
-
Traffic Sources so you can see where visitors are coming from
Feedback
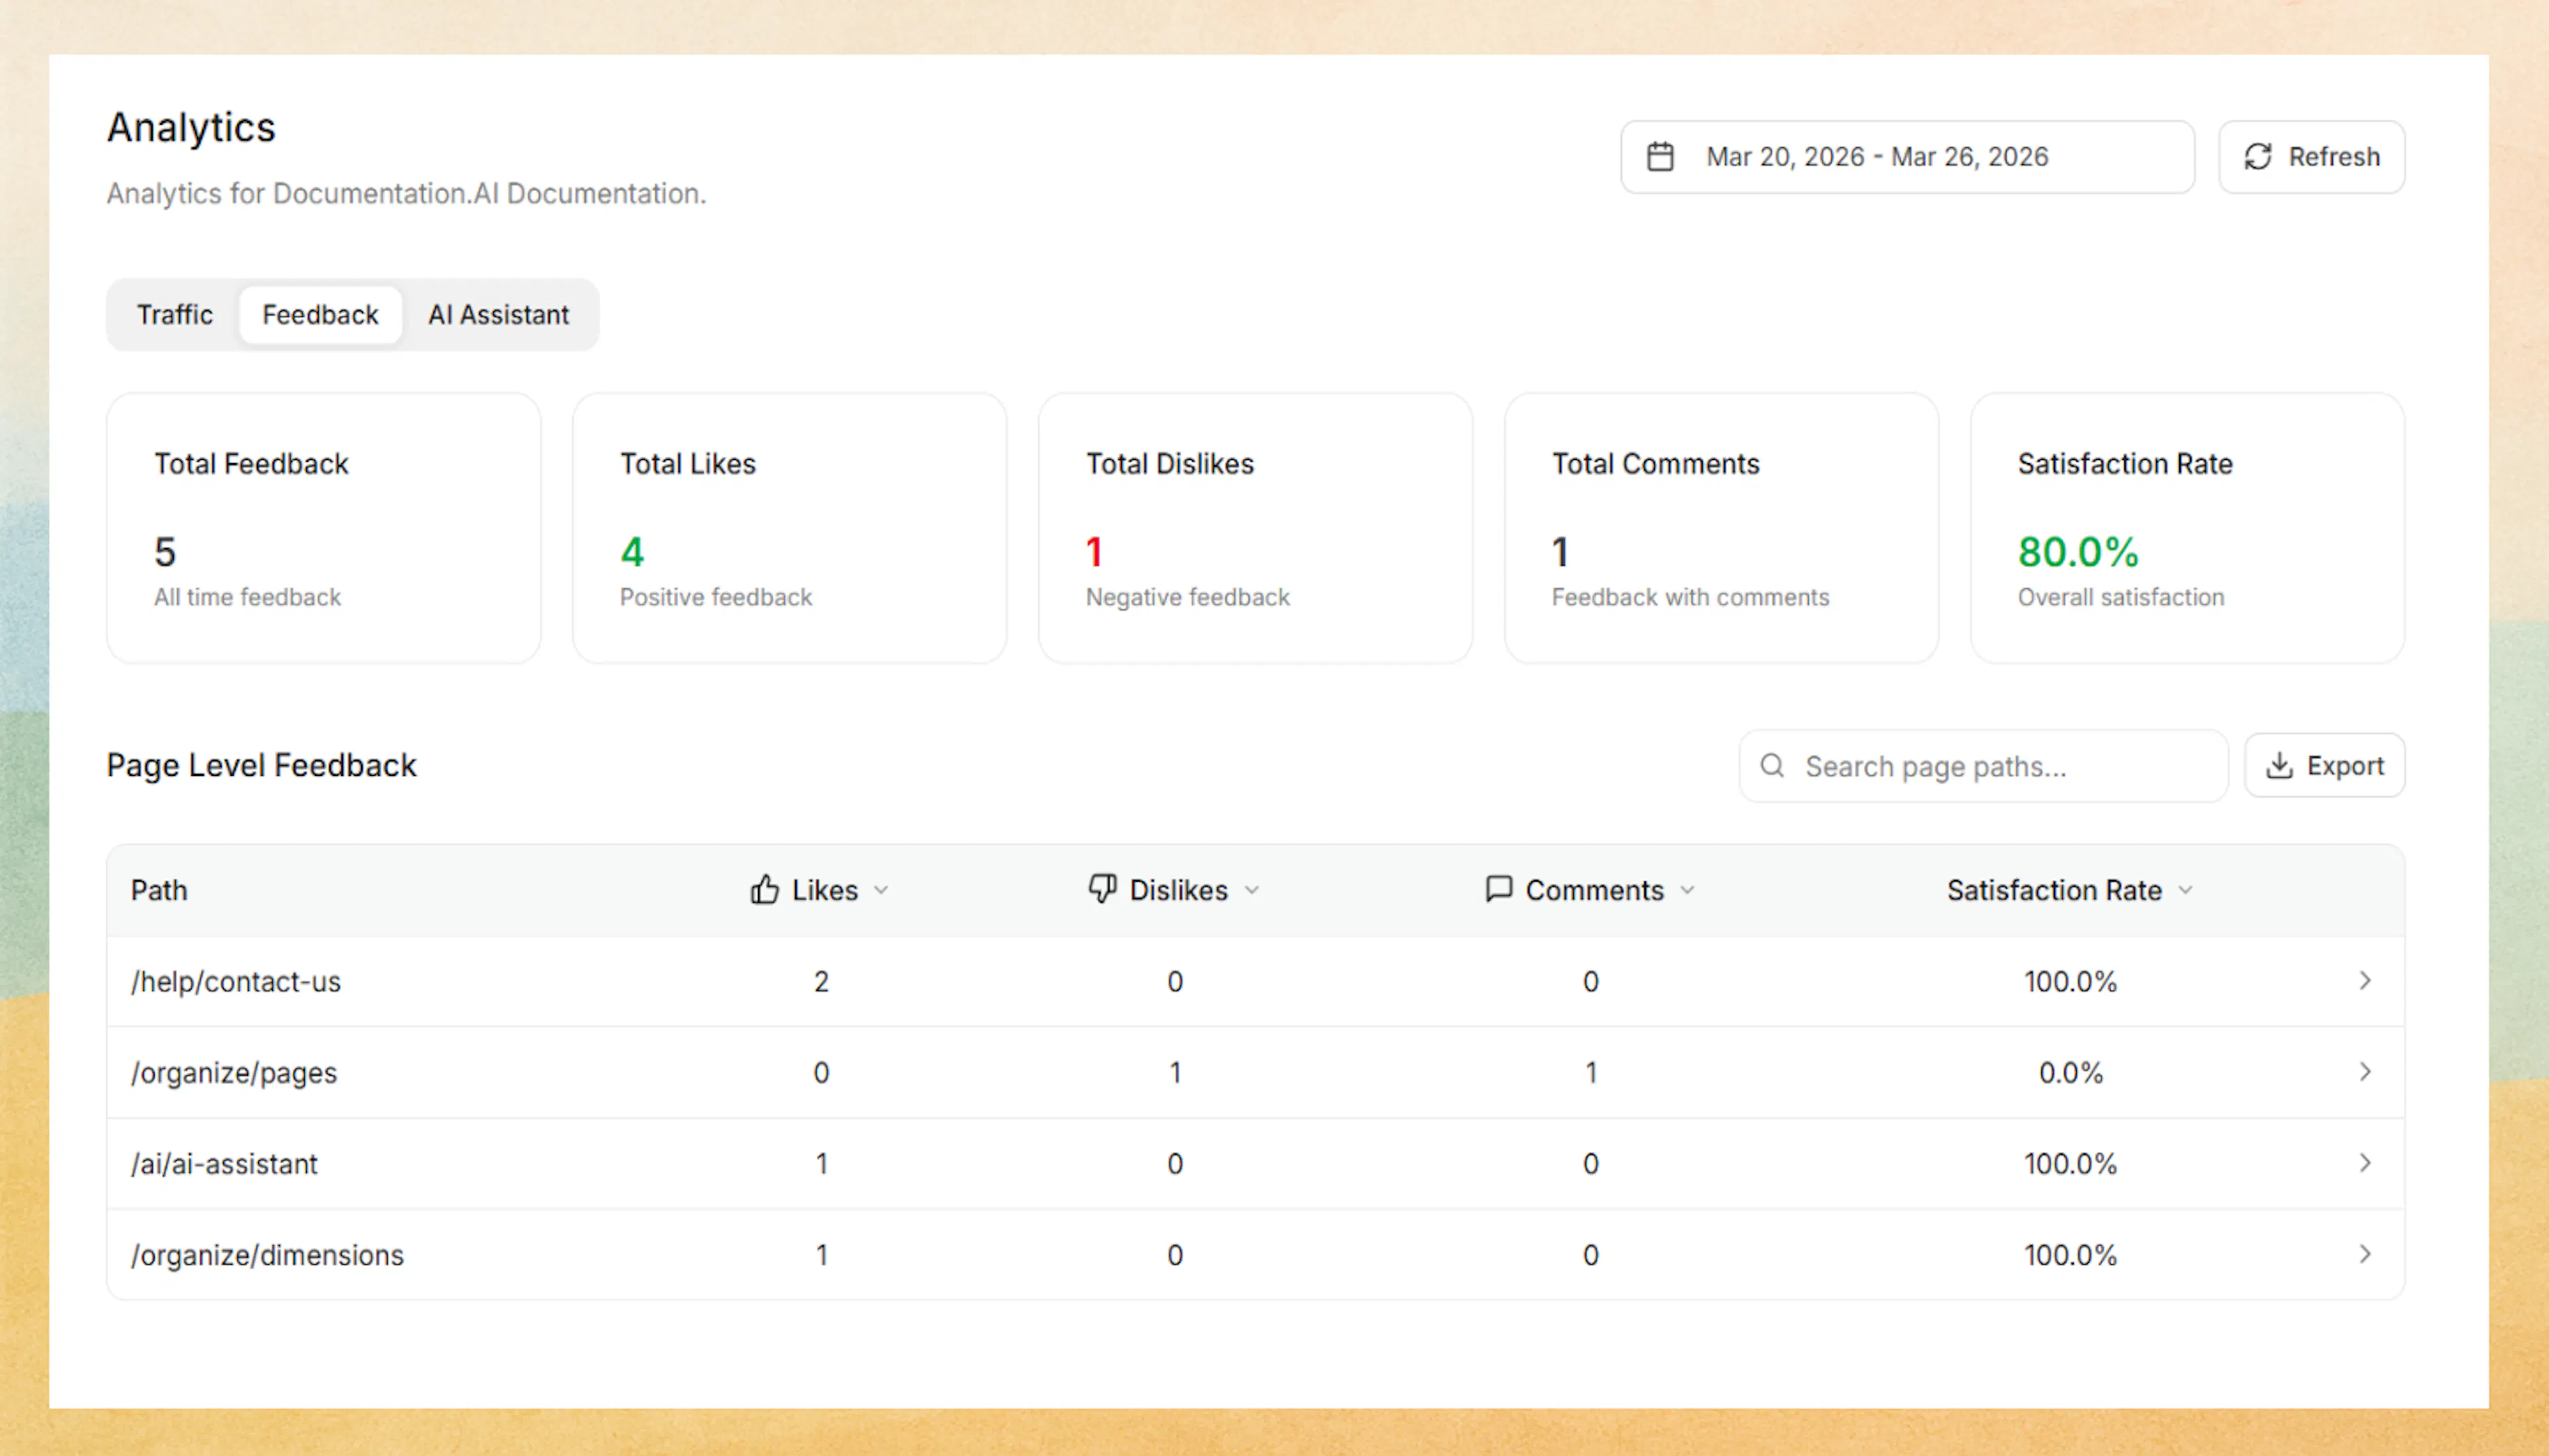
Feedback analytics shows how users feel about your content at both the summary and page level.
You can monitor:
-
Total Feedback, Total Likes, Total Dislikes, Total Comments, and Satisfaction Rate
-
A searchable and sortable page-level feedback table
-
Which pages receive the most positive or negative reactions
-
Individual feedback entries for a specific page, including the feedback type, reason, comment, and timestamp
Feedback analytics also supports CSV export for both page-level feedback data and page-specific feedback details, making it easier to review trends outside the dashboard or share findings with your team.
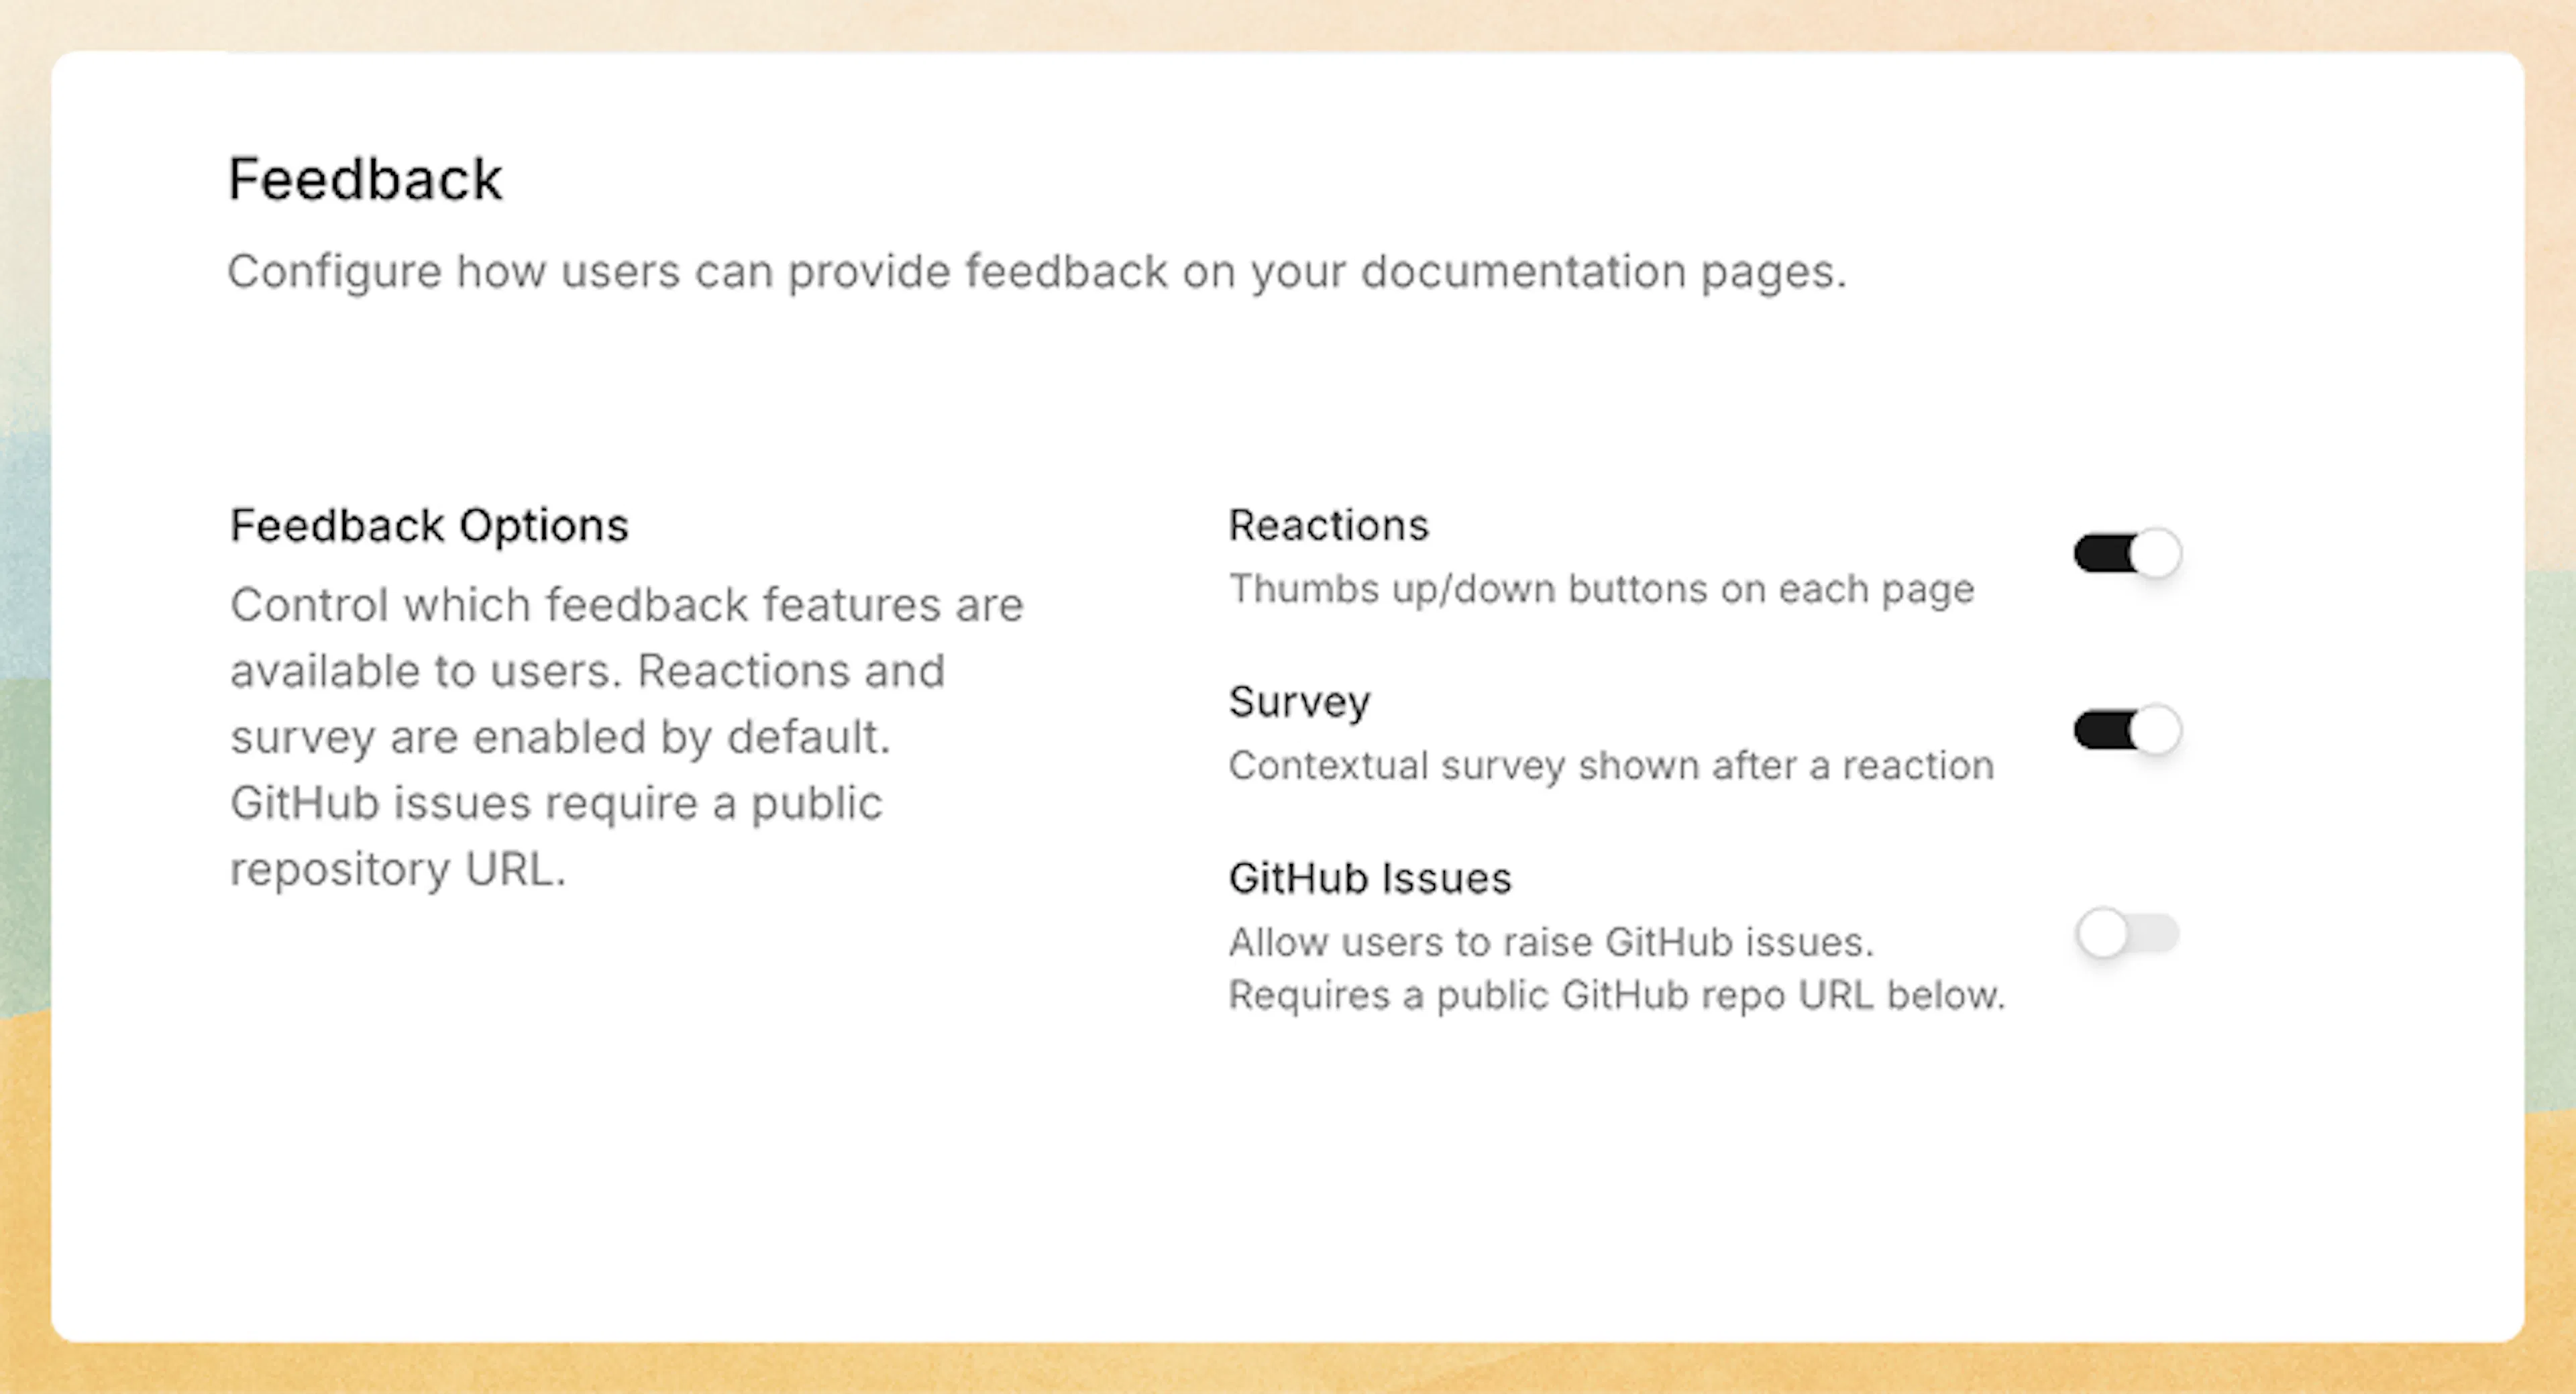
After a thumbs up or thumbs down reaction, you can optionally prompt readers for additional context using a short follow-up prompt. This captures free-text reasons or comments so you understand why they reacted the way they did. To configure feedback settings, in the Editor, click Site Config in the top toolbar, then select Feedback.
User feedback is a powerful signal for prioritizing updates, refining unclear topics, and validating whether recent changes are helping readers.
Ask AI Analytics
Ask AI Analytics gives you a dedicated view into how readers use the AI assistant across your documentation. You can use it to understand usage volume, answer quality, and which conversations may need follow-up improvements in your docs.
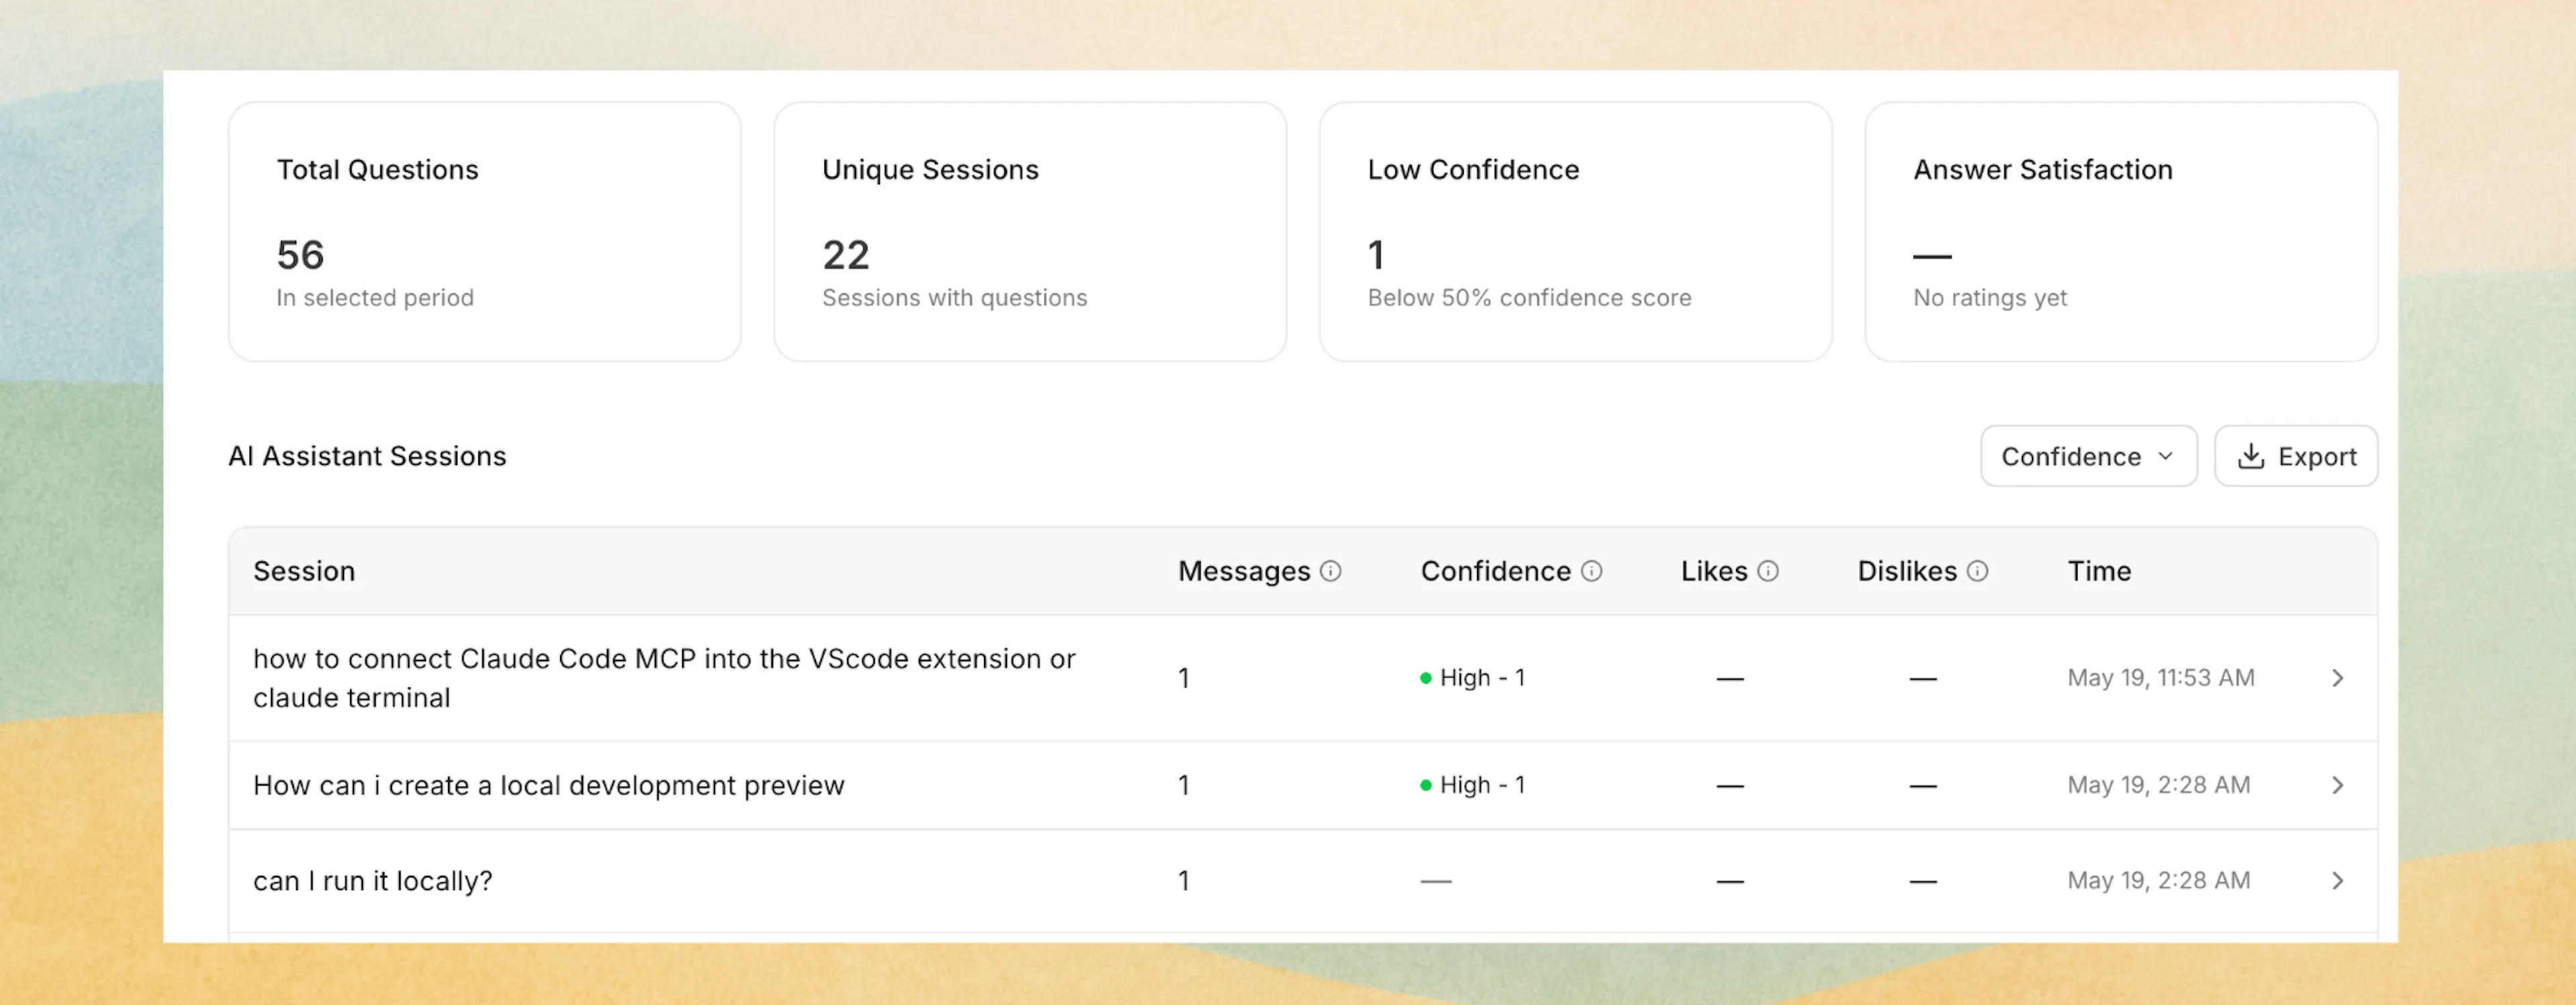
You can filter the AI Assistant view by date range and review four summary metrics:
-
Total Questions — the total number of Ask AI questions in the selected period
-
Unique Sessions — how many assistant sessions included at least one question
-
Low Confidence — answers scored below 50% confidence
-
Answer Satisfaction — the percentage of positive answer ratings when feedback exists
Below the summary cards, Ask AI data is grouped into AI Assistant Sessions so you can review conversations instead of only scanning individual questions. For each session, you can see:
-
The first question in the session
-
The total number of messages in that session
-
A confidence breakdown across answers in the session: High, Medium, and Low
You can also filter sessions by confidence level to quickly focus on conversations where the assistant may have struggled.
When you open a session, you can drill into the full conversation history for that session and review:
-
Each question
-
The AI generated answer
-
The confidence level for that answer
-
The timestamp for each message
Ask AI Analytics also supports CSV export with a custom export date range, so you can analyze question and answer data outside the dashboard or share it with your team. The sessions table also supports Load more pagination for browsing additional history.
Confidence levels are grouped as High (80% and above), Medium (50% to under 80%), and Low (below 50%).
Third-party analytics
In addition to built-in analytics, you can send tracking data to external platforms like Google Analytics, PostHog, Mixpanel, and more using built-in integrations. For tools not covered by built-in integrations, use custom scripts to inject any tracking snippet.